To obtain a license for this software, place an order here =>
|
|
|
Edge detection |
| Image Registration and Fusion Systems |
Purpose of edge detection
Most information in an image resides along the edges. Therefore, it
makes sense to select the features used in image registration along
edges. Edge detection can be considered a preprocessing
operation that increases the speed in feature selection and feature
correspondence.
Edge detection methods
A number of edge detection methods have been included in an
easy-to-use interactive software. Implemented methods are: (A)
Zero-crossings of Laplacian of Gaussian (LoG) edges, (B) authentic
zero-crossing LoG edges, (C) points of locally maximum gradients
in the gradient direction, and (D) functional approximation. These
methods find edges based on intensity differences. A method based
on intensity ratios (E) is also included in this software. This method
detects more details in darks areas in an image than methods A - D
that are based on intensity differences. Finally, a method to detect
edges in color images is included.
Examples
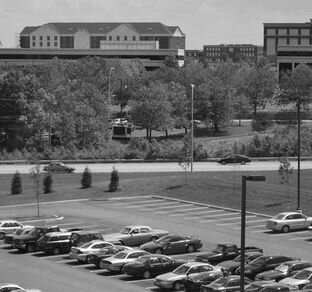
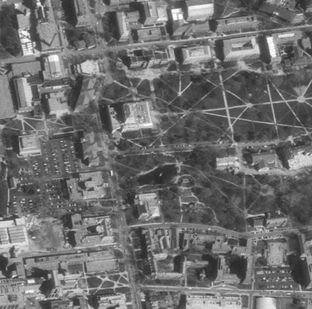
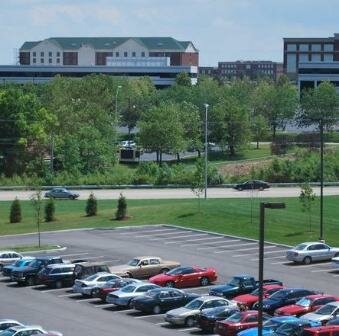
Edge detection examples on an outdoor scene image, an aerial
urban scene image, and a radar image (Fig. 1) are shown below.
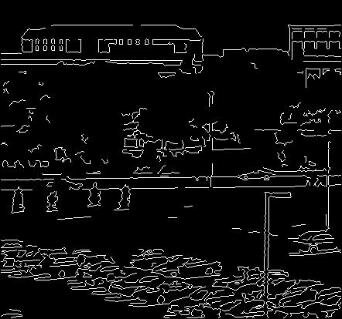
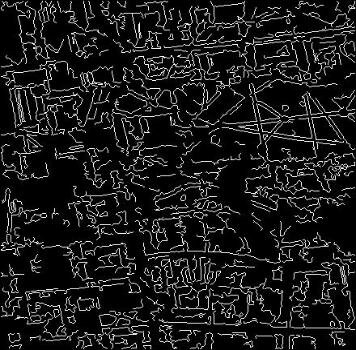
Fig. 2 shows edges detected by method A after removal of weak and
noisy edges. Standard deviation of the Gaussian for the outdoor
scene image and the aerial image was 1.5 pixels, while that for the
radar image was 2.5 pixels to reduce more noise.
Method B removes false edges of method A, and since false edges
are usually weak, edges detected by method B after removal of
weak edges are almost the same as those obtained by method A
after removal of weak edges.
Method C avoids detection of false edges, so that detected edges
are similar to those detected by method B. Method C finds locally
maximum gradient points in the gradient direction, while method B
finds zero-crossings of the image second derivative and from
among the zero-crossings removes those that correspond to locally
minimum gradient magnitudes, thus, removing the false edges.
If the objective is to detect strong edges in an image, methods A, B,
and C all detect very similar edges.
Most information in an image resides along the edges. Therefore, it
makes sense to select the features used in image registration along
edges. Edge detection can be considered a preprocessing
operation that increases the speed in feature selection and feature
correspondence.
Edge detection methods
A number of edge detection methods have been included in an
easy-to-use interactive software. Implemented methods are: (A)
Zero-crossings of Laplacian of Gaussian (LoG) edges, (B) authentic
zero-crossing LoG edges, (C) points of locally maximum gradients
in the gradient direction, and (D) functional approximation. These
methods find edges based on intensity differences. A method based
on intensity ratios (E) is also included in this software. This method
detects more details in darks areas in an image than methods A - D
that are based on intensity differences. Finally, a method to detect
edges in color images is included.
Examples
Edge detection examples on an outdoor scene image, an aerial
urban scene image, and a radar image (Fig. 1) are shown below.
Fig. 2 shows edges detected by method A after removal of weak and
noisy edges. Standard deviation of the Gaussian for the outdoor
scene image and the aerial image was 1.5 pixels, while that for the
radar image was 2.5 pixels to reduce more noise.
Method B removes false edges of method A, and since false edges
are usually weak, edges detected by method B after removal of
weak edges are almost the same as those obtained by method A
after removal of weak edges.
Method C avoids detection of false edges, so that detected edges
are similar to those detected by method B. Method C finds locally
maximum gradient points in the gradient direction, while method B
finds zero-crossings of the image second derivative and from
among the zero-crossings removes those that correspond to locally
minimum gradient magnitudes, thus, removing the false edges.
If the objective is to detect strong edges in an image, methods A, B,
and C all detect very similar edges.
Fig. 1. (Top) An outdoor scene image. (Middle) An aerial image
of an urban scene. This image is courtesy of USGS. (Bottom)
An MR brain image slice. This image is courtesy of NIH..
of an urban scene. This image is courtesy of USGS. (Bottom)
An MR brain image slice. This image is courtesy of NIH..
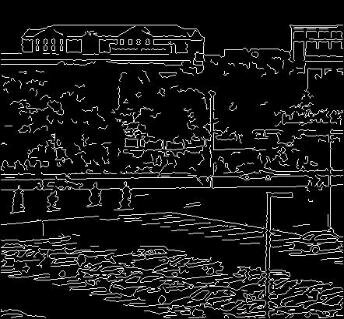
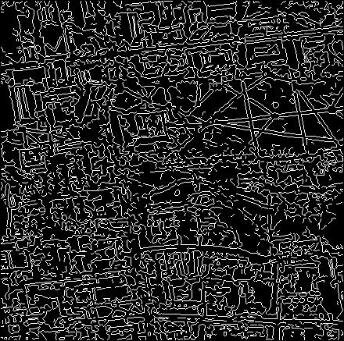
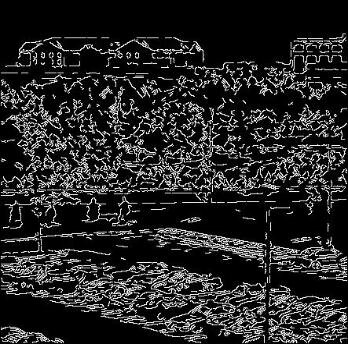
Fig. 2. Edges detected by method A after interactive removal of weak and noisy edges. Similar edges are obtained by the methods
B and C after removal of weak and noisy edges.
B and C after removal of weak and noisy edges.
Edge detection by intensity ratios
Edges represent image pixels with locally maximum intensity
changes. Change is measured by intensity difference. Change
can be quantified using intensity ratio also. Certain sensors do
not convert scene properties to image intensities linearly, so use
of intensity difference to detect edges may not be appropriate. In
sensors where recorded intensities relate to scene properties
exponentially, locally maximum change in intensity ratio is
preferred over locally maximum intensity difference when
detecting the edges. This edge detector uses the properties of
the human visual system to detect edges in an image. Edge
detection results by intensity ratios (method E) are shown in Fig
4. Intensity ratio method tends to detect more edges in dark
areas compared to intensity difference method, and intensity
difference method tends to detect more edges in bright areas
compared to the intensity ratio method.
| Fig. 4. Edges detected by intensity ratios. |
Edge detection by functional approximation
Considering intensities in an image as samples from a 2-D
continuous signal, edges in an image can be obtained by
approximating a surface to the image intensities and detecting
surface points with second derivatives that are zero. Since the
process deals with a continuous surface, the location of edges
can be determines with subpixel accuracy. Examples of edge
detection by functional approximation (method D) are given in
Fig. 3. Detected edges are similar to those obtained by
methods A - C after removal of weak and noisy edges.
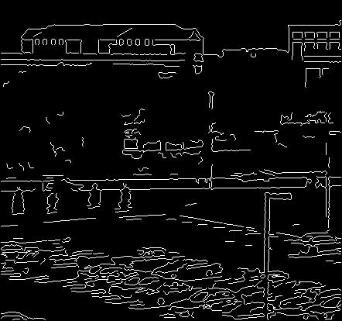

| Fig. 3. Edges detected by functional approximation. |
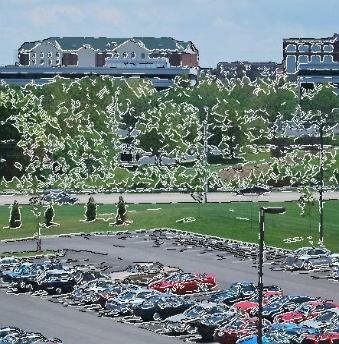
Edge detection in color images
Pixel values in a color image represent vectors. Here, the
objective is to detect locally maximum color changes in the
image domain. Edges in a color image after removal of weak
and noisy edges are shown in Fig. 5.
This software can read a variety of image formats and can
save the edges in a variety of formats, including jpg, gif, png,
pgm, and ppm.
| Fig. 5. Edges detected in a color image. |